
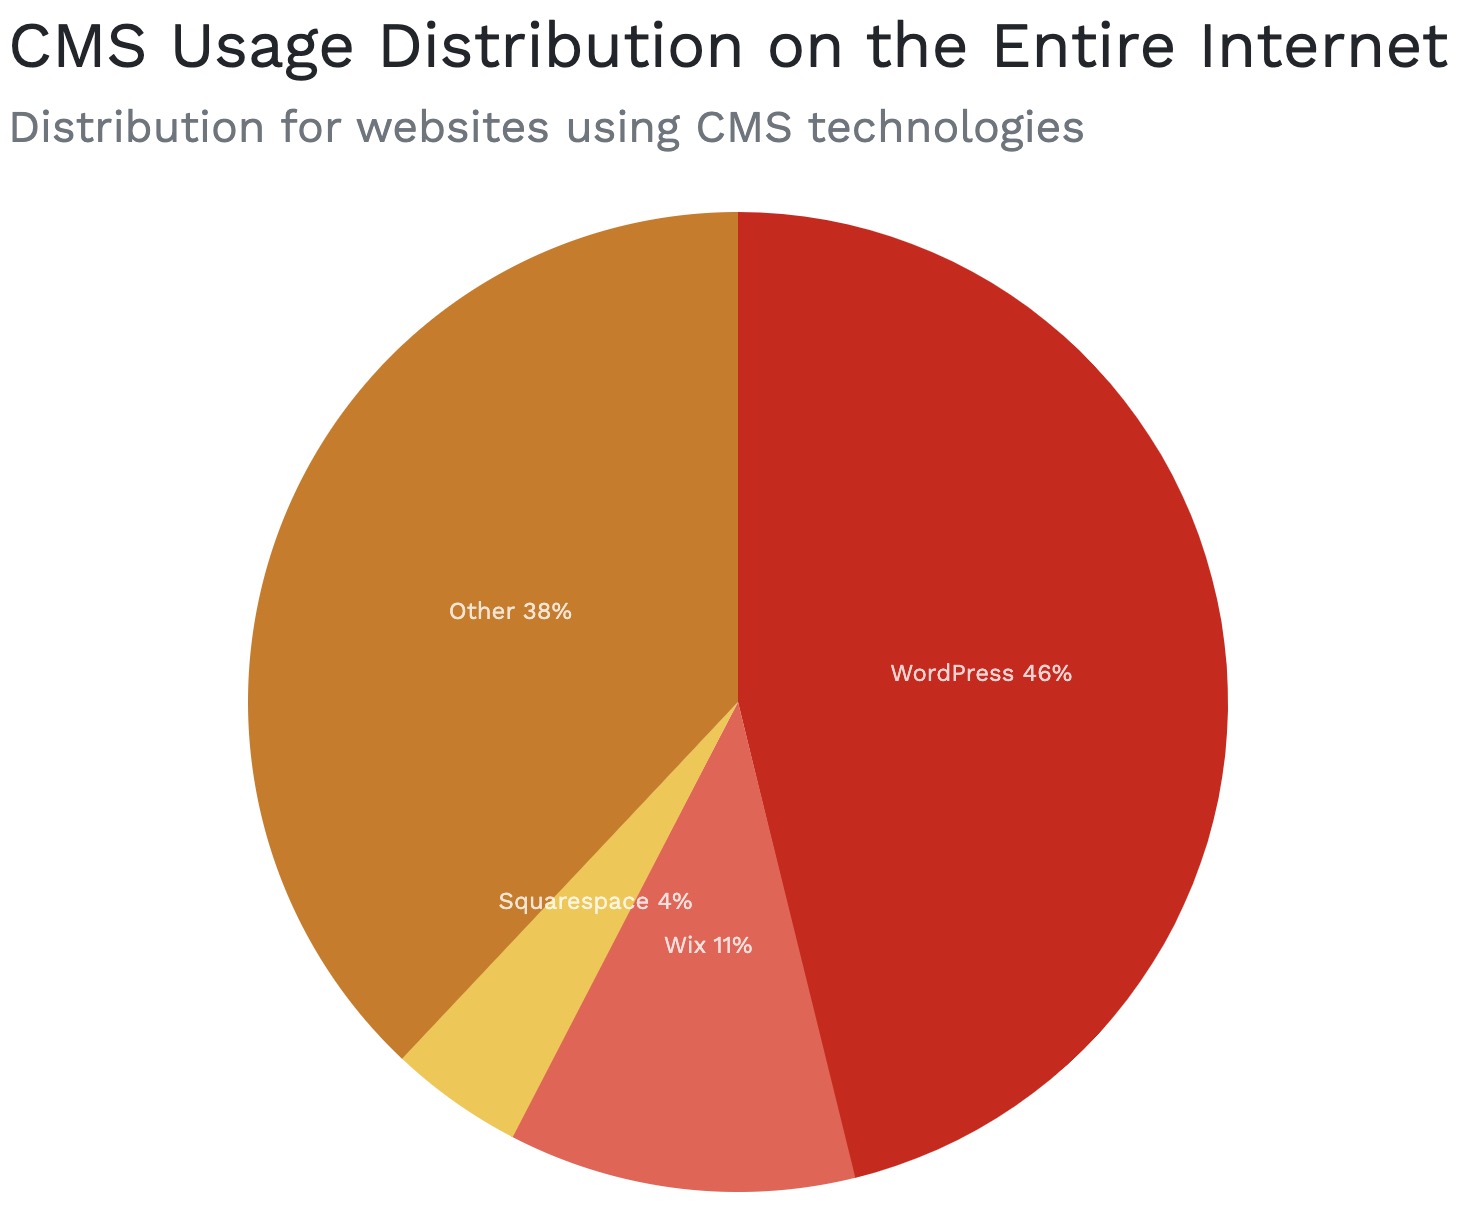
As you likely know, WordPress software powers 46% of all websites on the Internet. I thought it would be fun to dive a bit deeper and note some trends that affect the WP community.
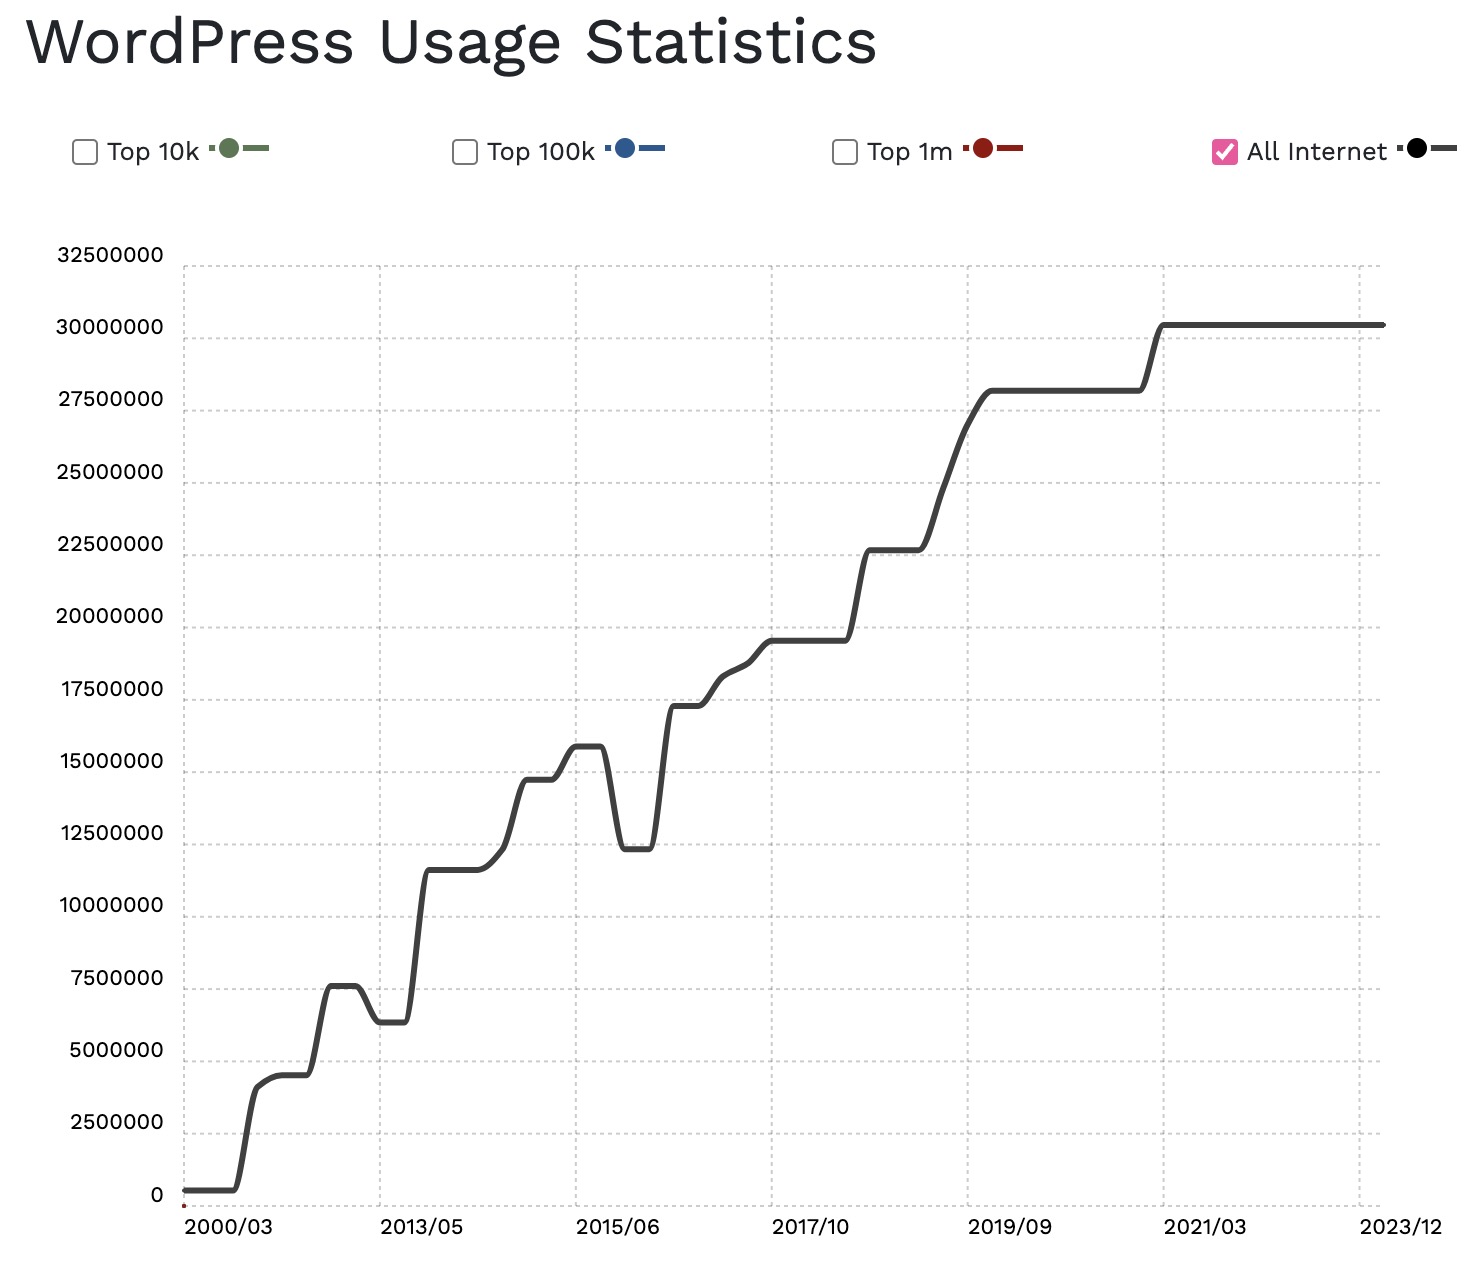
WordPress usage remains dominant and steady
Since its founding in 2003, WordPress usage has risen steadily and consistently:
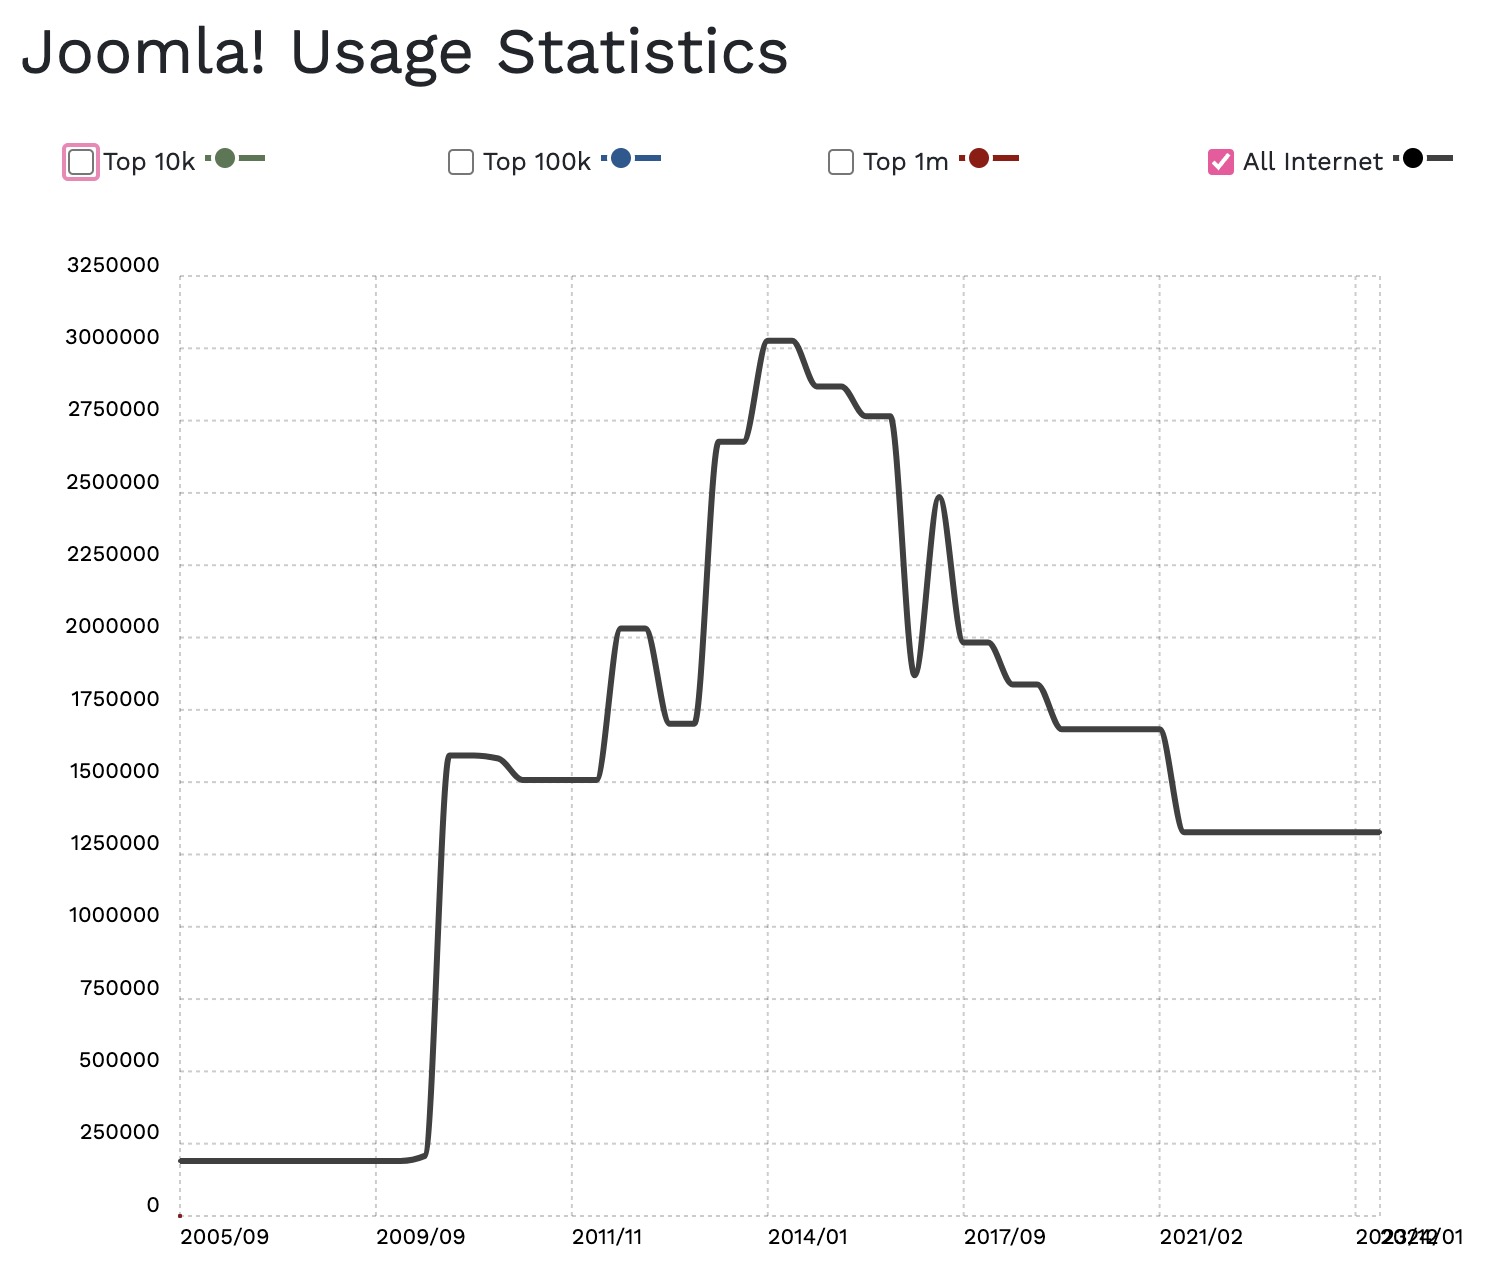
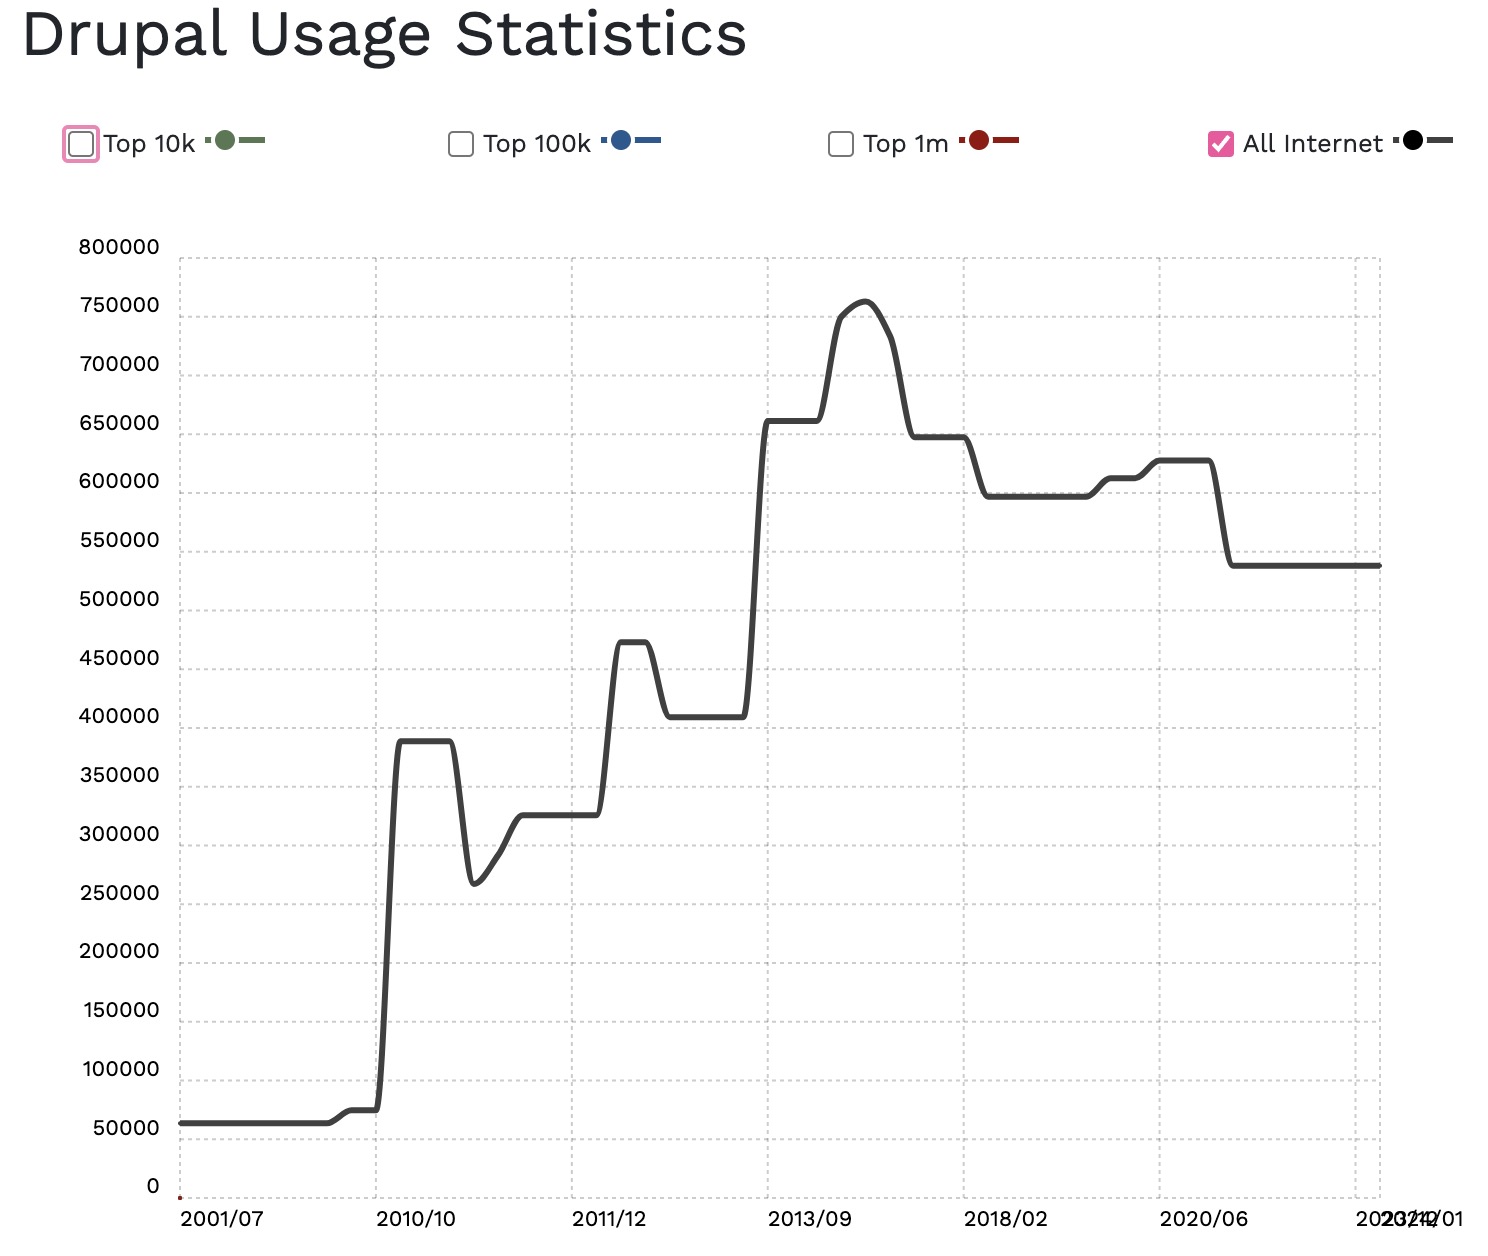
WP consultants who are old enough will recall that Drupal and Joomla commanded a large share of the market early on – not anymore.
Both are down considerably since their peaks around 2015:
Antiquated software is still used quite a bit in the WP community
Getting people to update software and run security patches is difficult on any platform. WP and related tech seems to be no exception to that rule.
Antiquated WordPress Core Installs
Almost 20% of all WP sites are running a very old version of WP, the good news is that old versions of WP are still patched for security vulnerabilities.
- 5% of WP sites are using the 4.x branch. That’s approximately 1.7 million websites worldwide that are running this old branch. Version 4.9 was released in 2017.
- Around 13% of WP sites are using the 5.x branch, which had its last feature update in January 2022.
- All told, at least 18% of WP websites haven’t upgraded to the current 6.x branch yet.
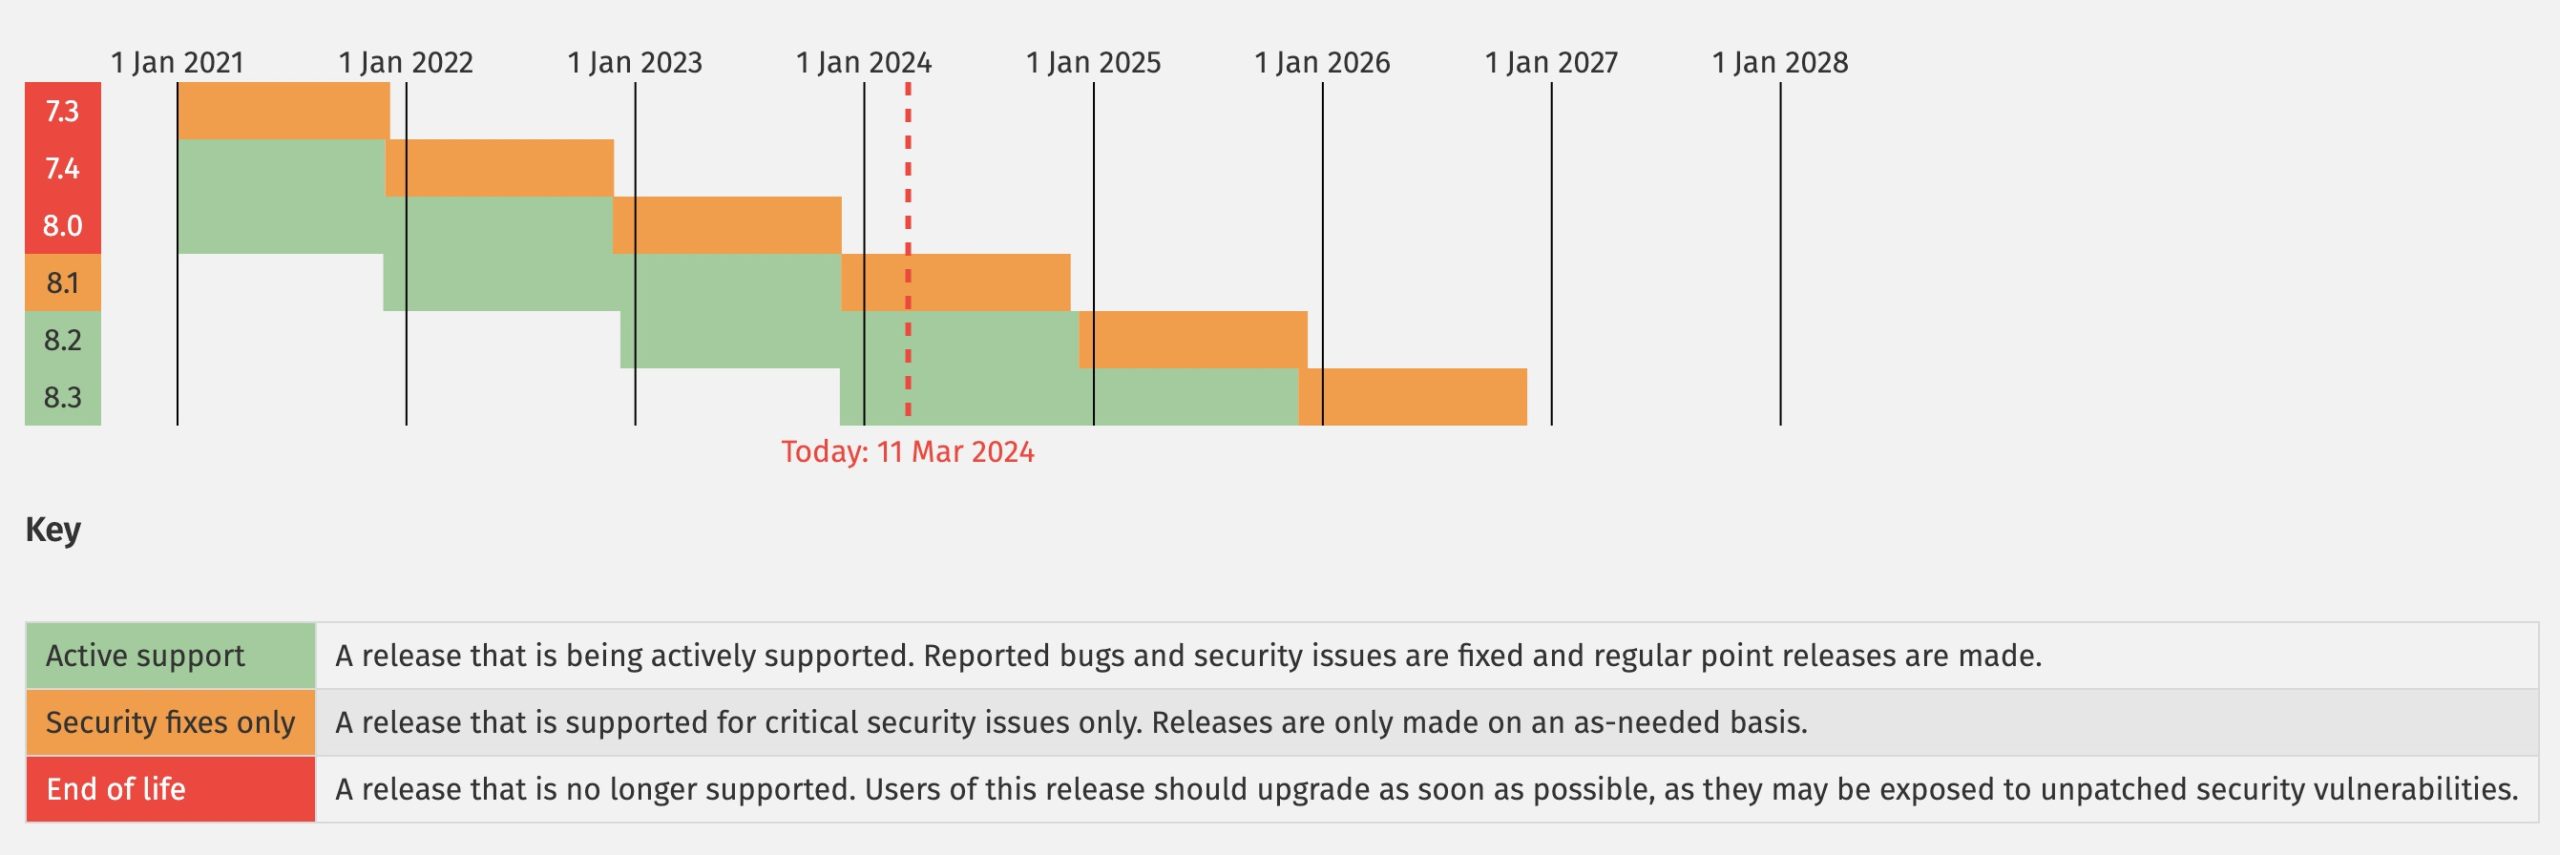
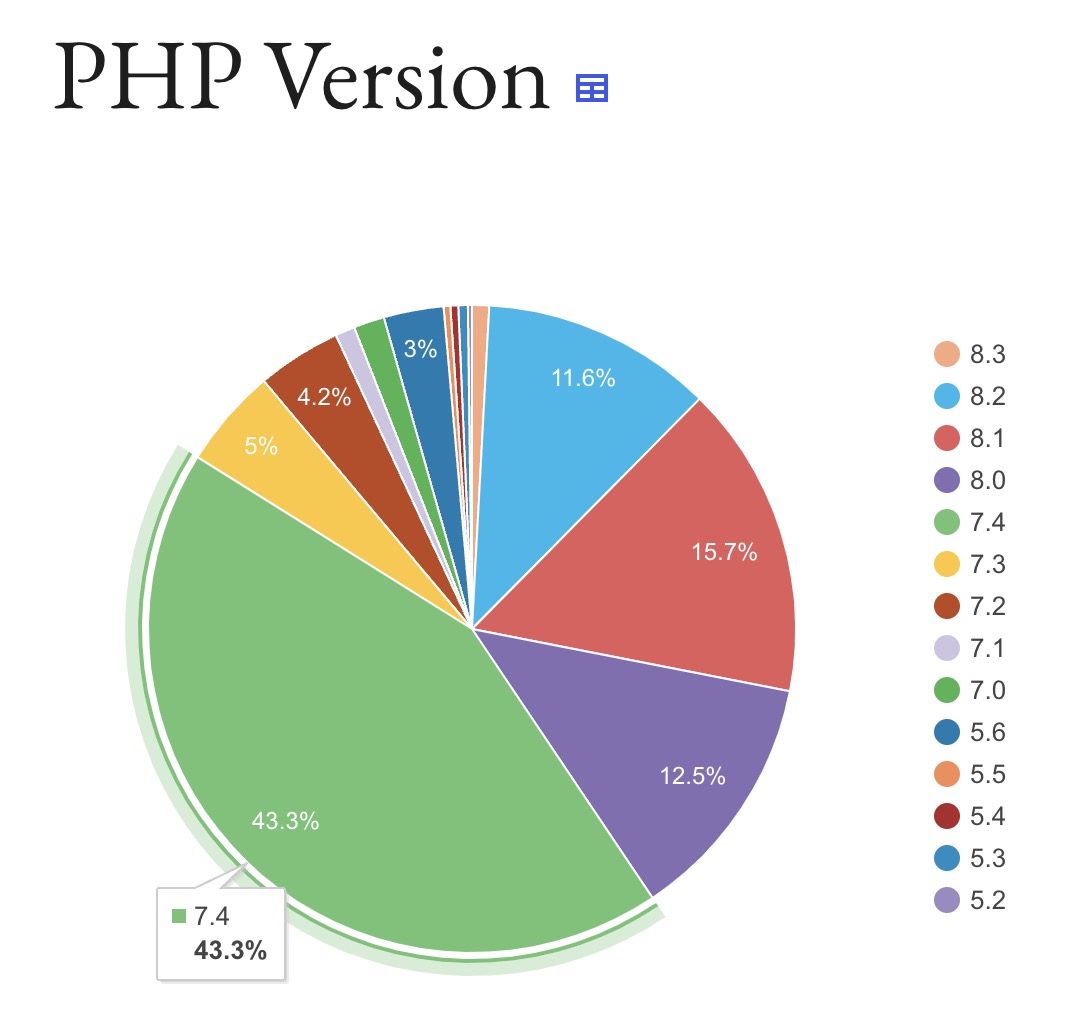
Antiquated PHP
As we’ll see below, 3-out-of-every-4 WP installs are potentially insecure due to antiquated versions of PHP running on the server.
- Almost 75% of WP sites are using unsupported versions of PHP. If you are running PHP 8.0 or earlier, then you are running a version that has already reached “end of life” and might not receive security patches.
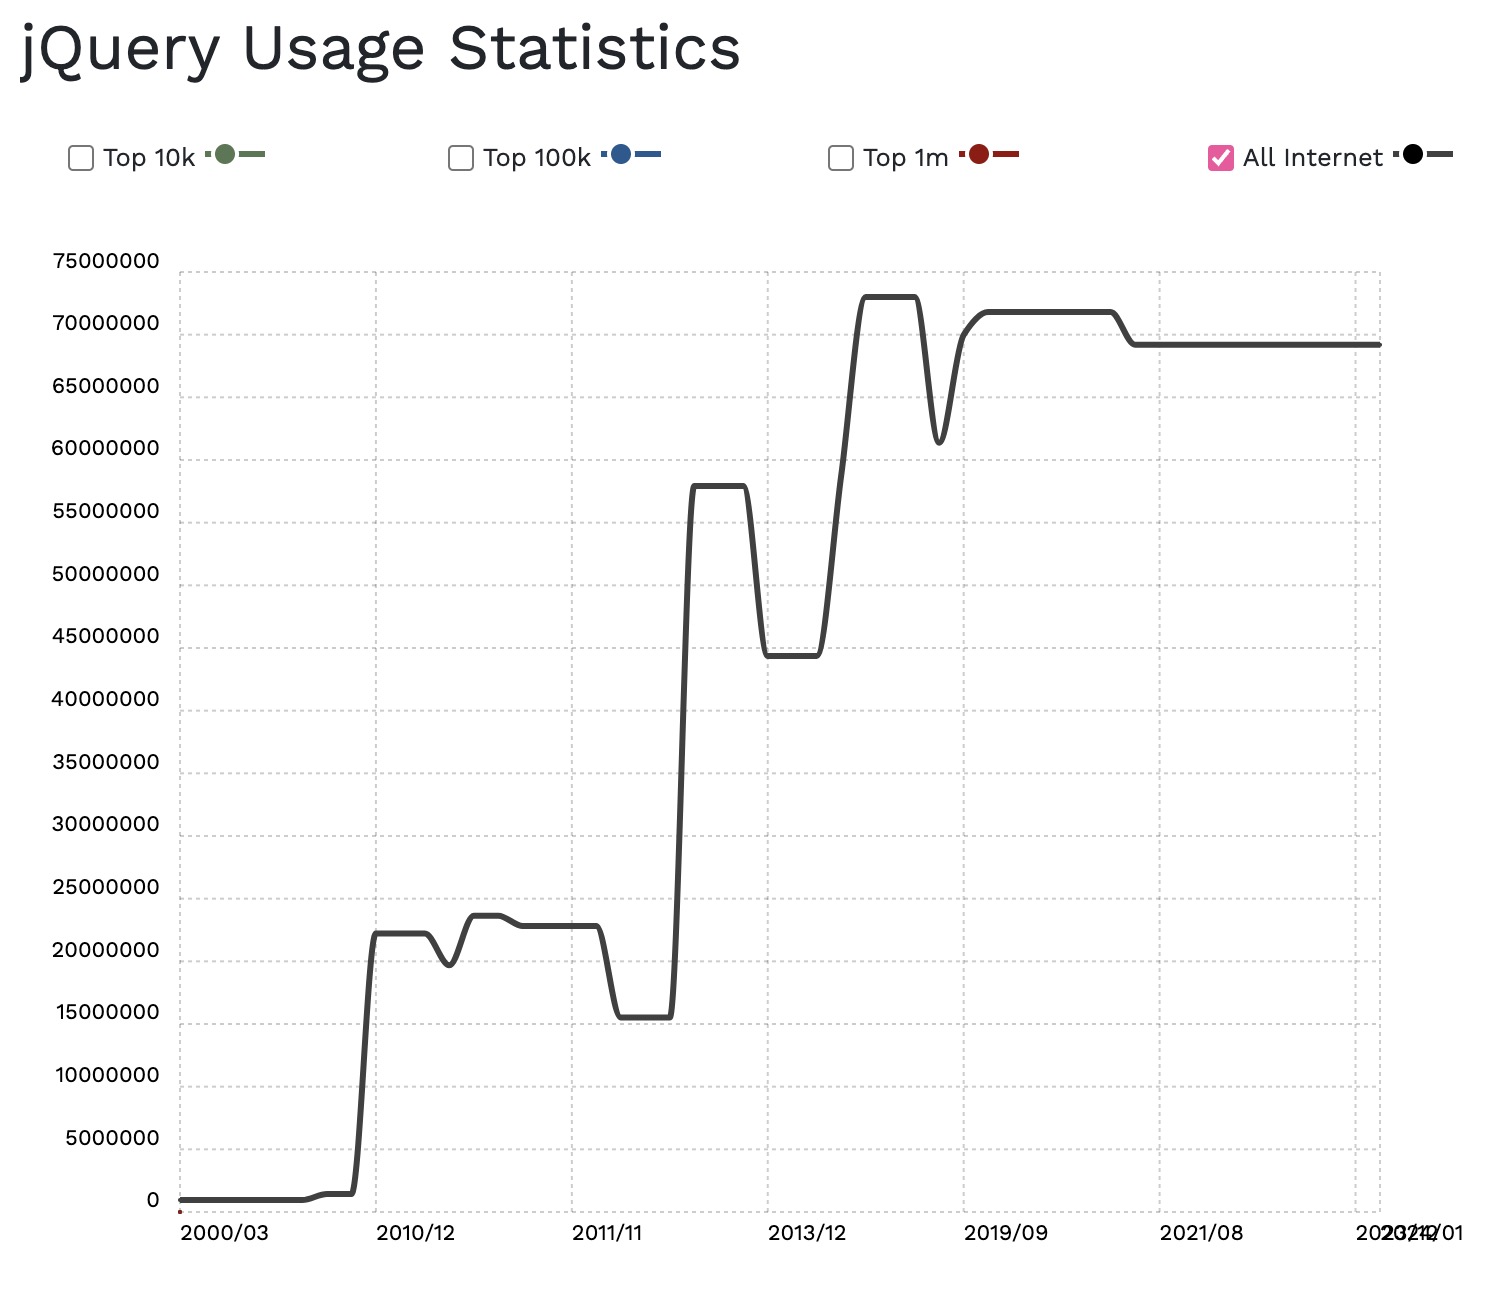
jQuery is still riding high!
What’s not to love about jQuery?! You can quickly write code that does all sorts of fancy animations and other things without knowing a whole lot about javascript.
It’s not clear how much of this high jQuery usage is due to tech debt vs new code, but what is clear is that jQuery is one of the most-used languages in WordPress:
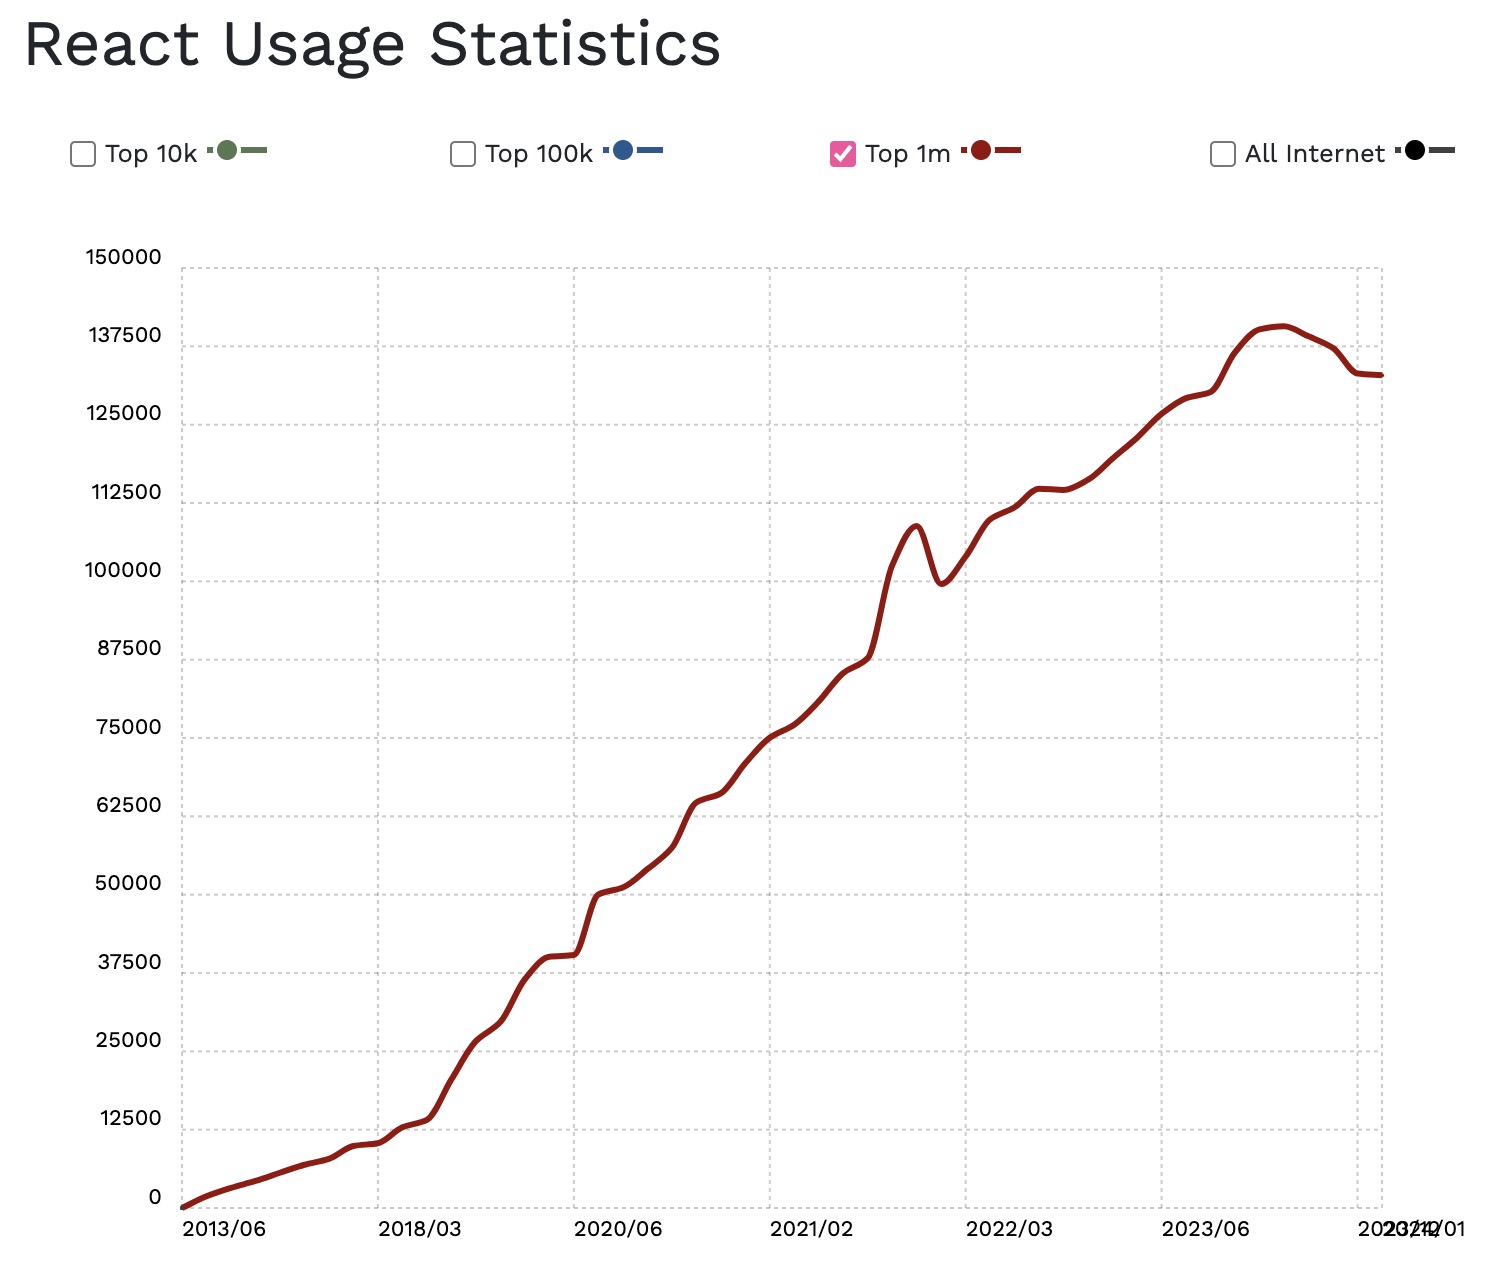
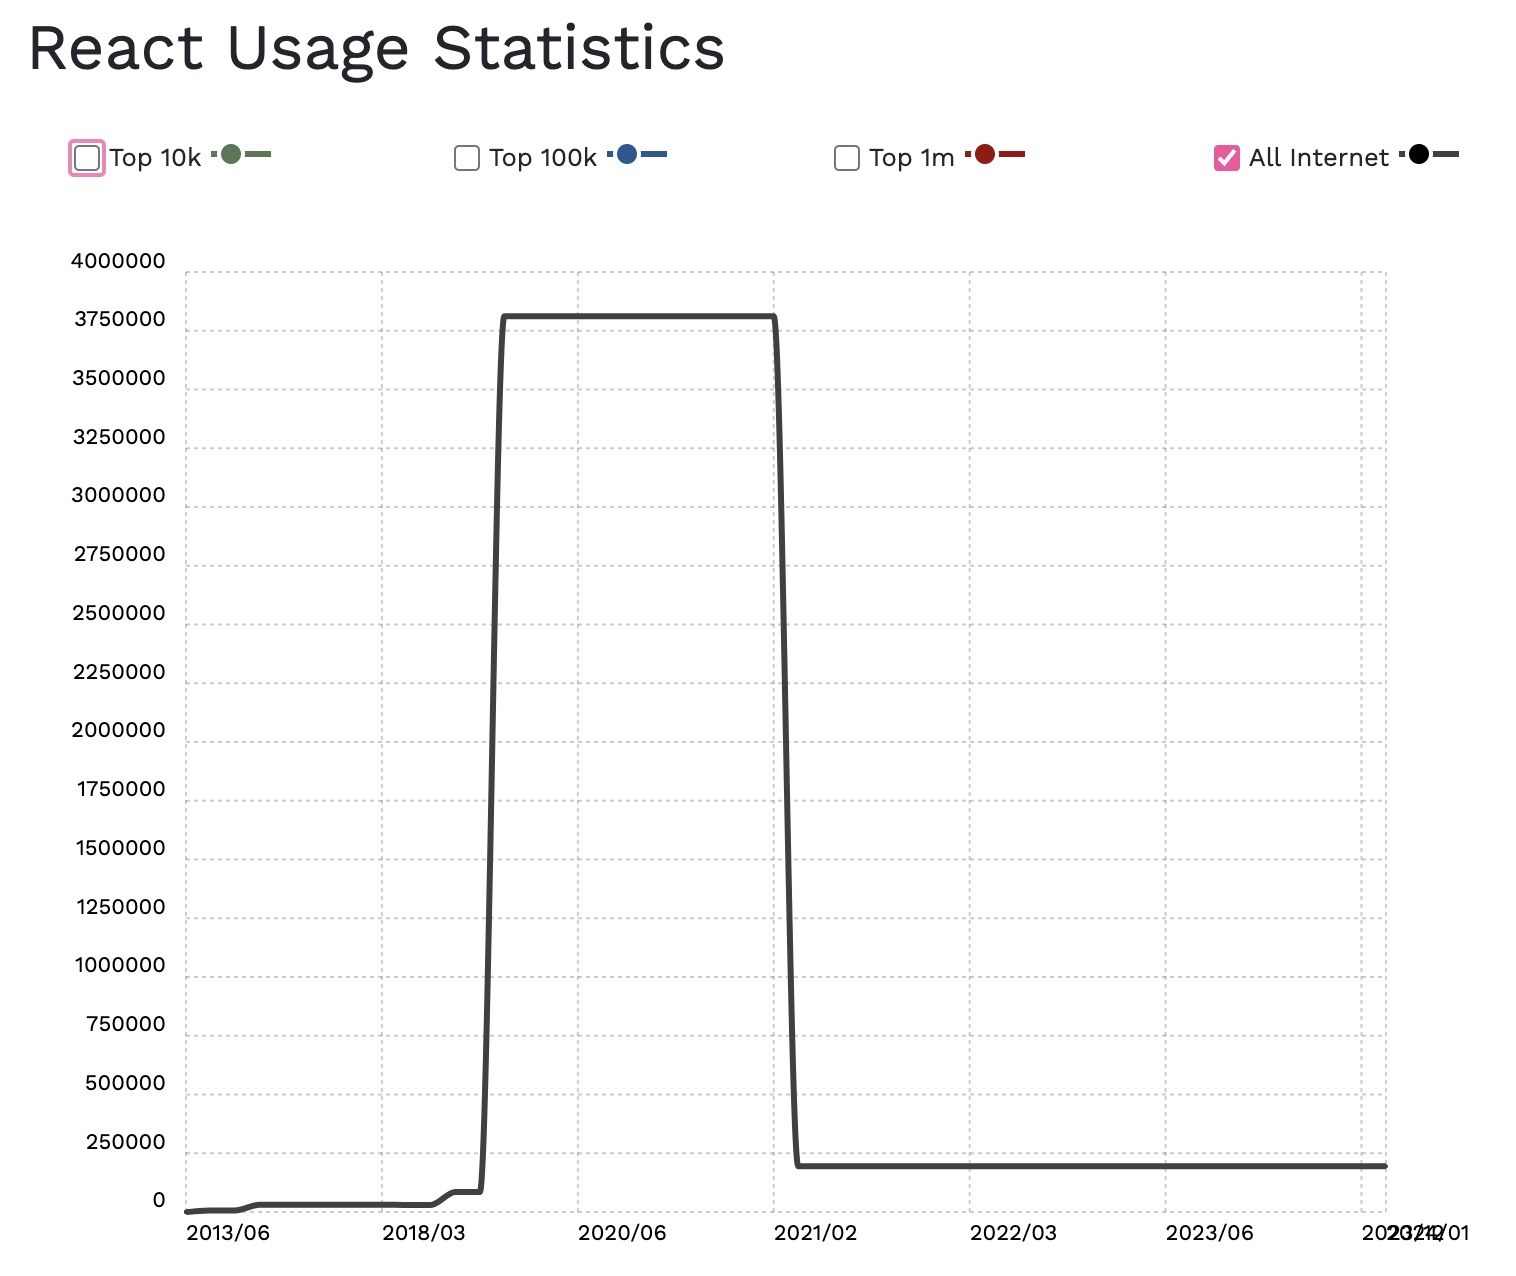
React usage is up for the top 1 million sites but way down overall
As you likely know, React is used to build most Gutenberg blocks, so it is now widely-used in the WP community. The story is more nuanced when looking at sites worldwide.
React seems to be gaining popularity in the top 1 million websites:
However, React usage is way down Internet-wide:
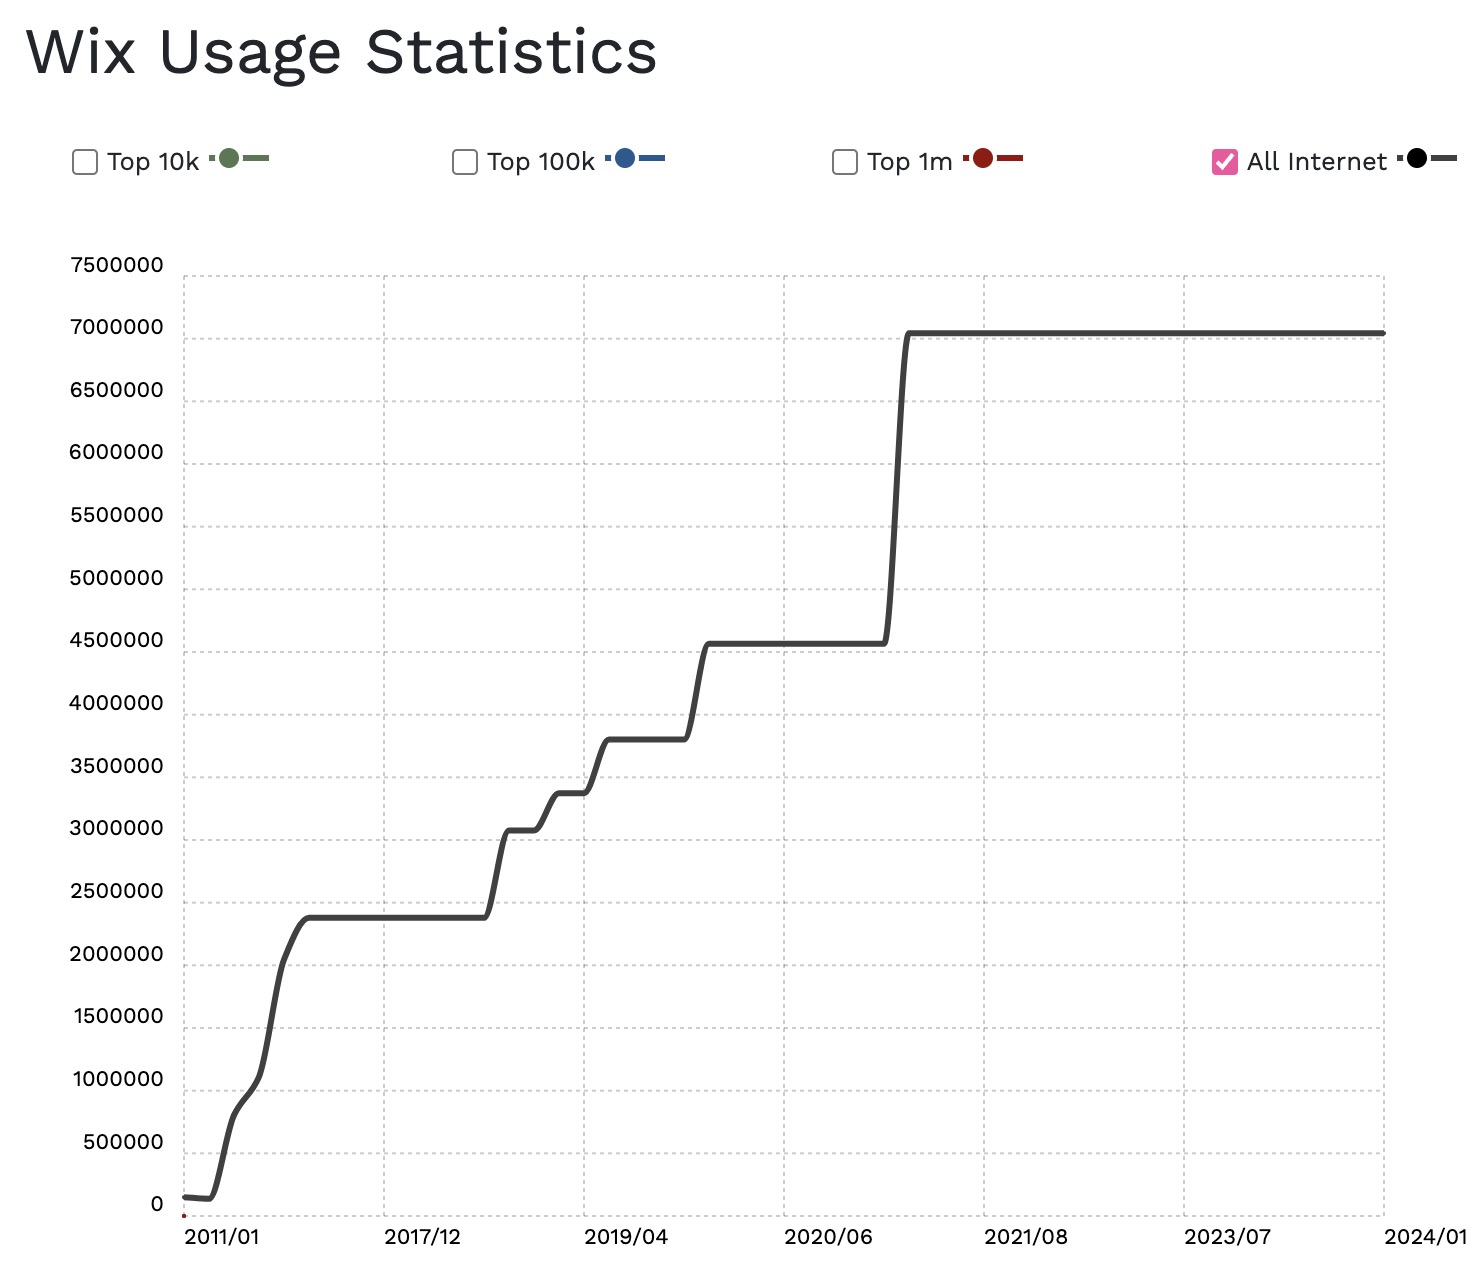
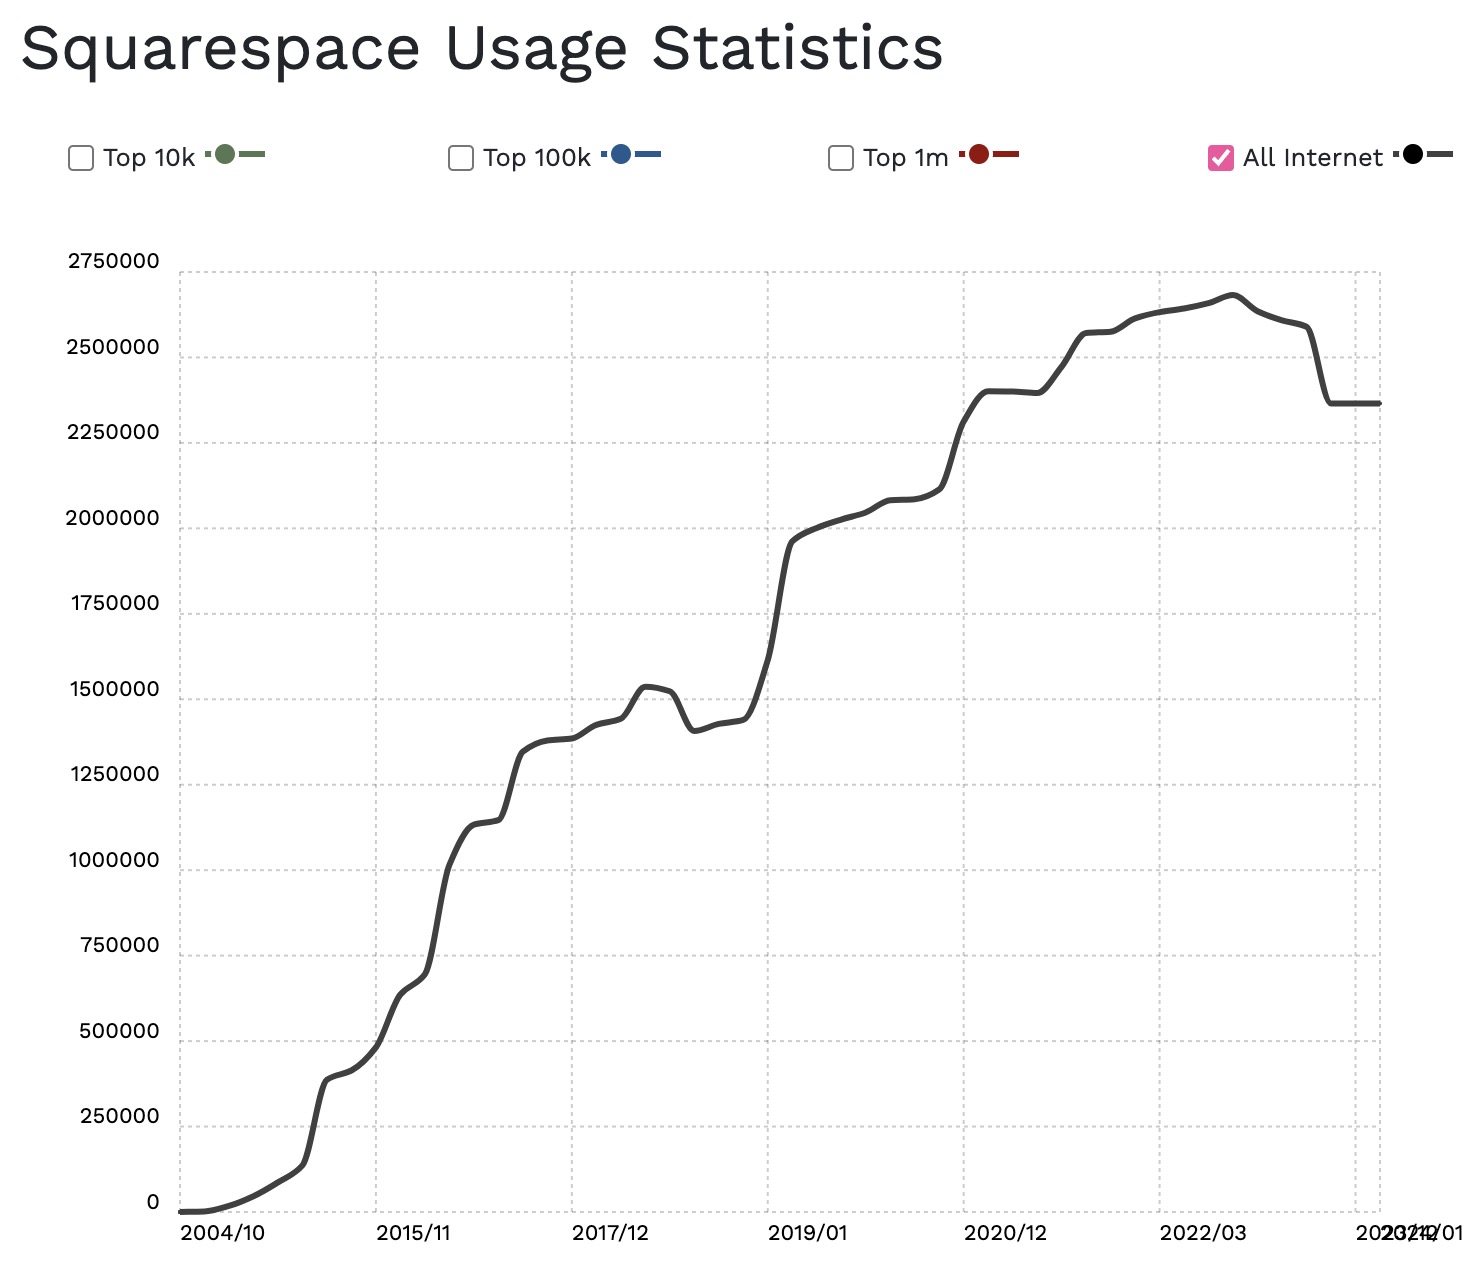
WordPress’ competitors are rocking!
Perhaps you’ve heard of two of WP’s main competitors: Squarespace and Wix. Well, they are both doing quite well:
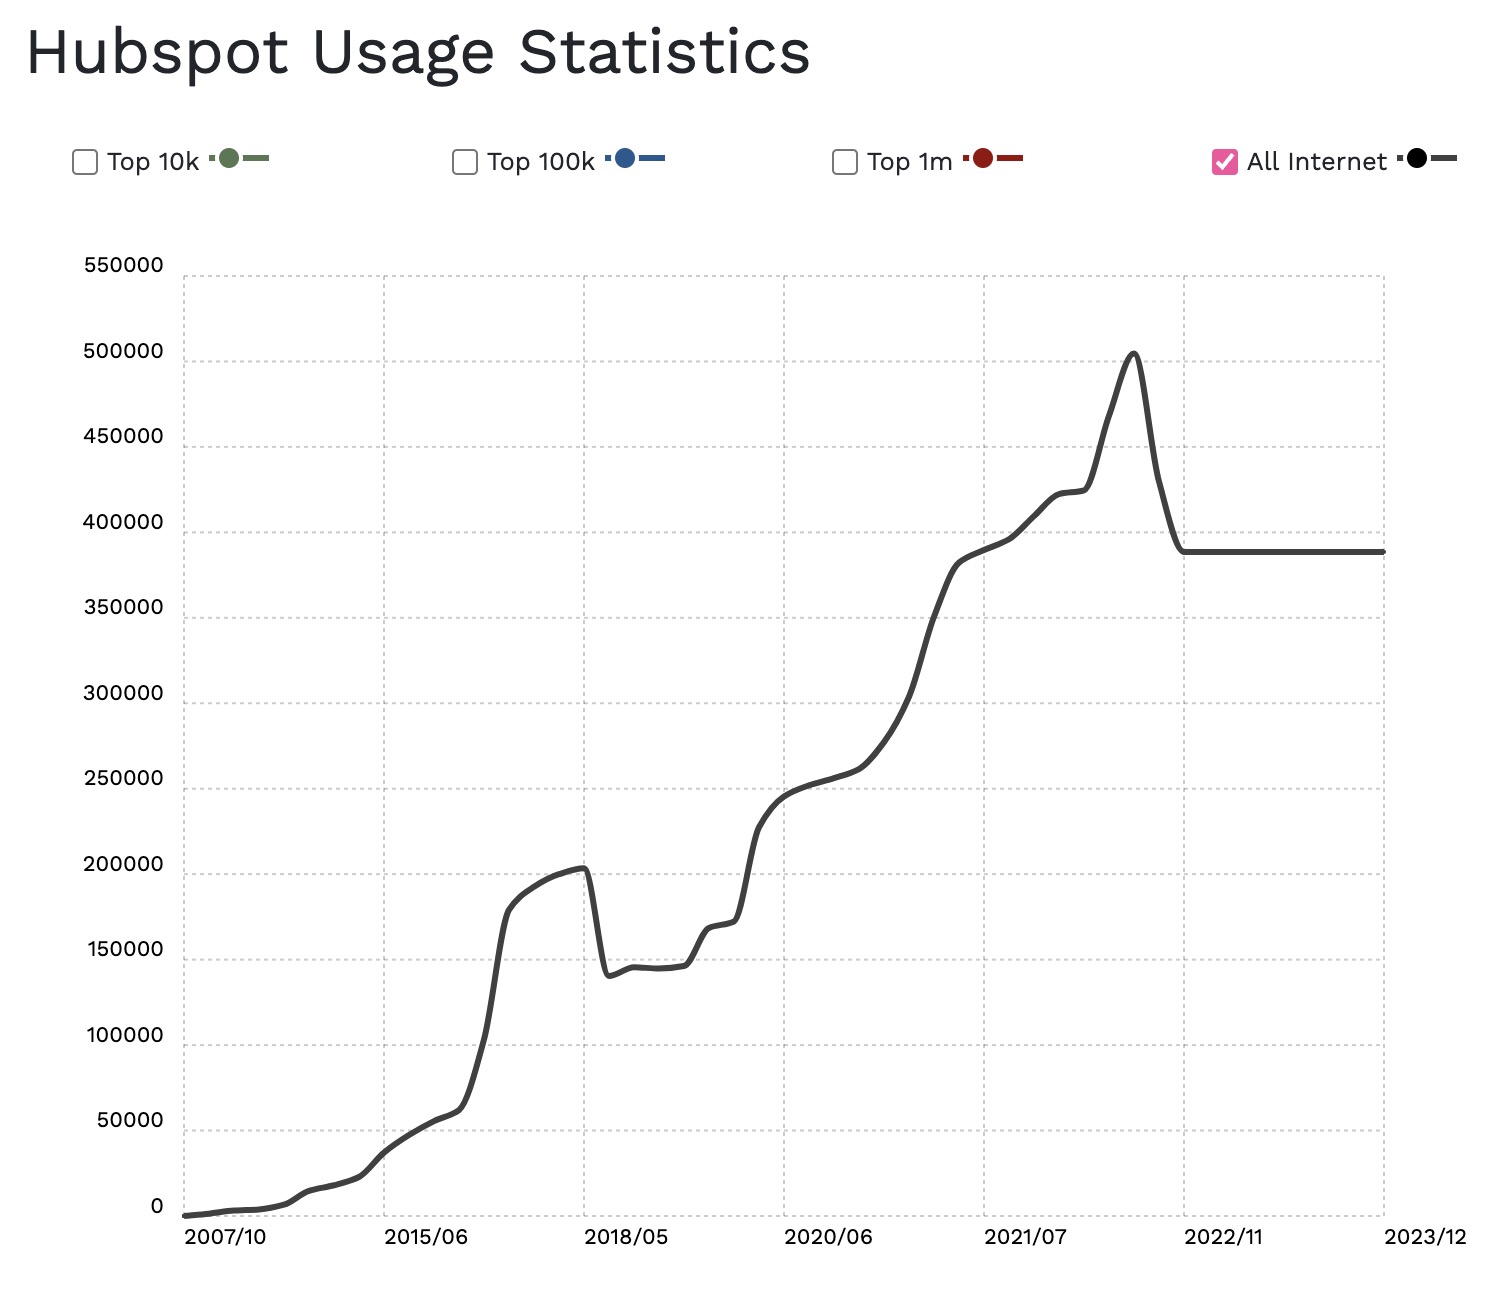
I’ve noticed in my WP consulting practice that a lot of my clients are using Hubspot Landing Page Builder in addition to WordPress – usually to host and track downloads of 1-off lead generation pdfs and related form leads. So I was curious how Hubspot’s competing product is doing.
Hubspot Landing Page Builder usage has gone down a bit recently but still maintains a notable market share:
What about e-commerce?
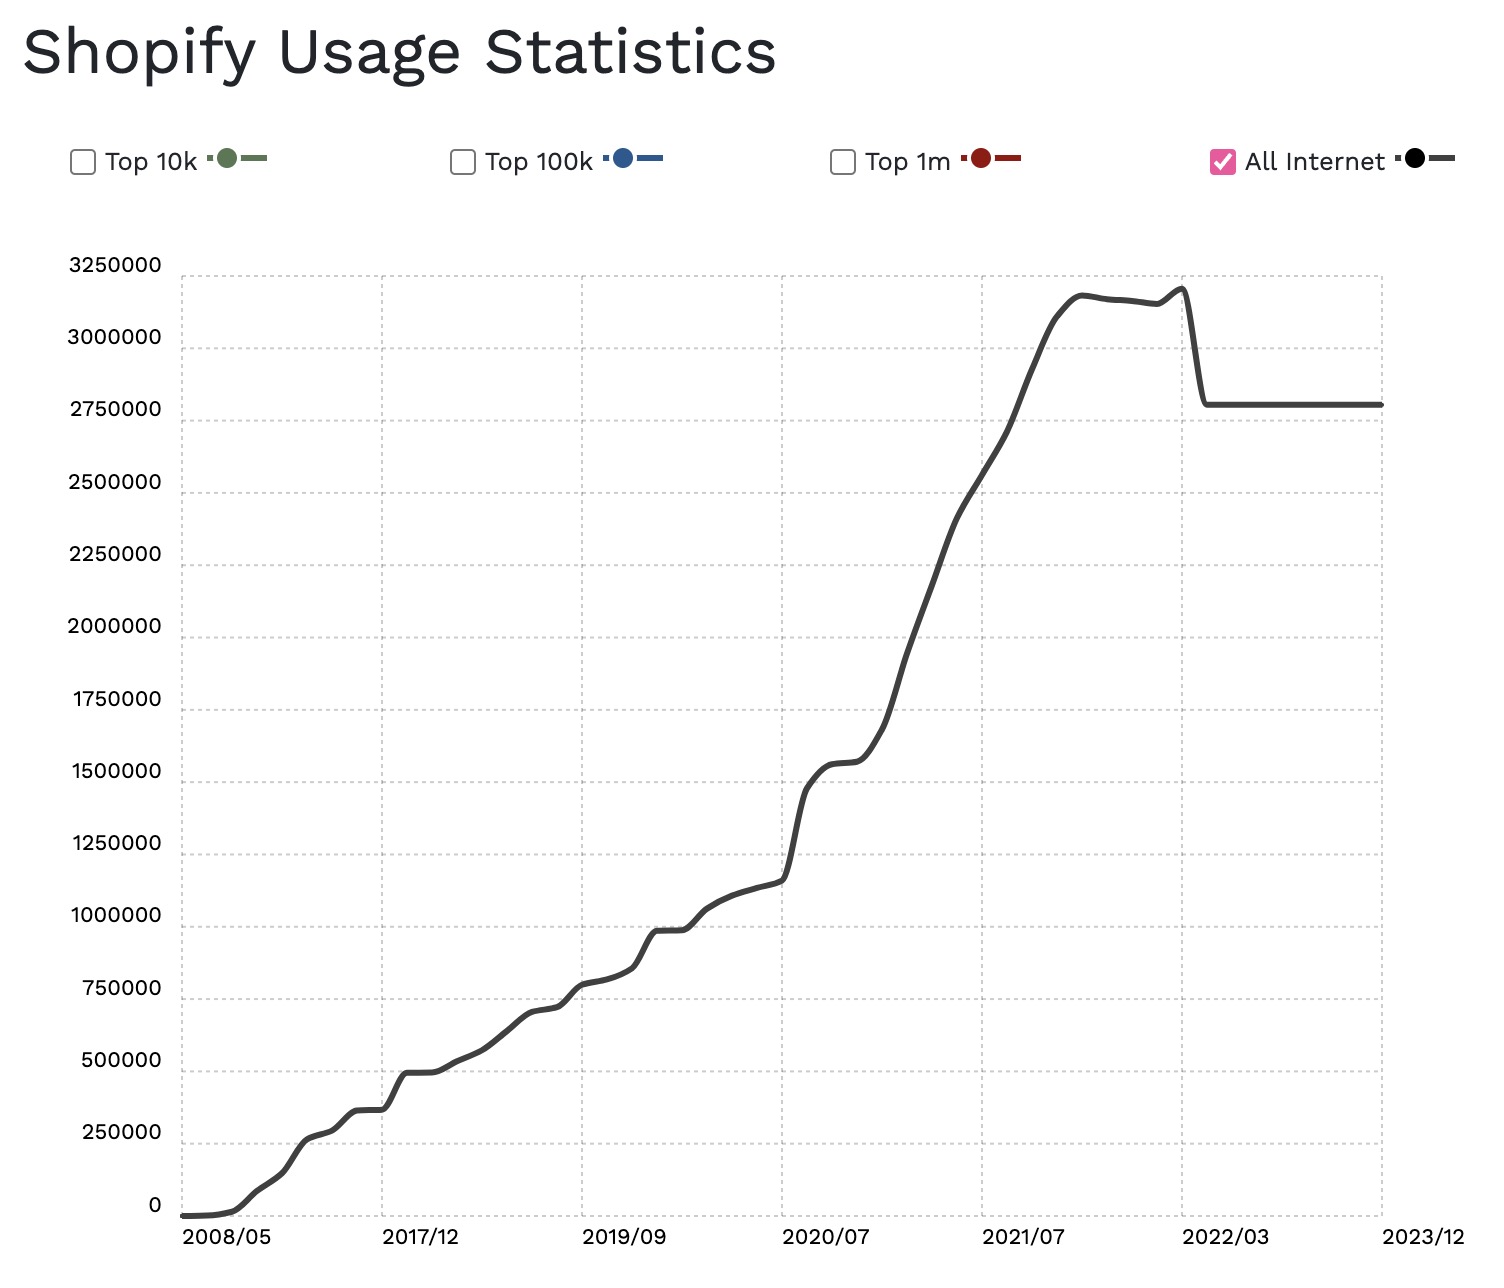
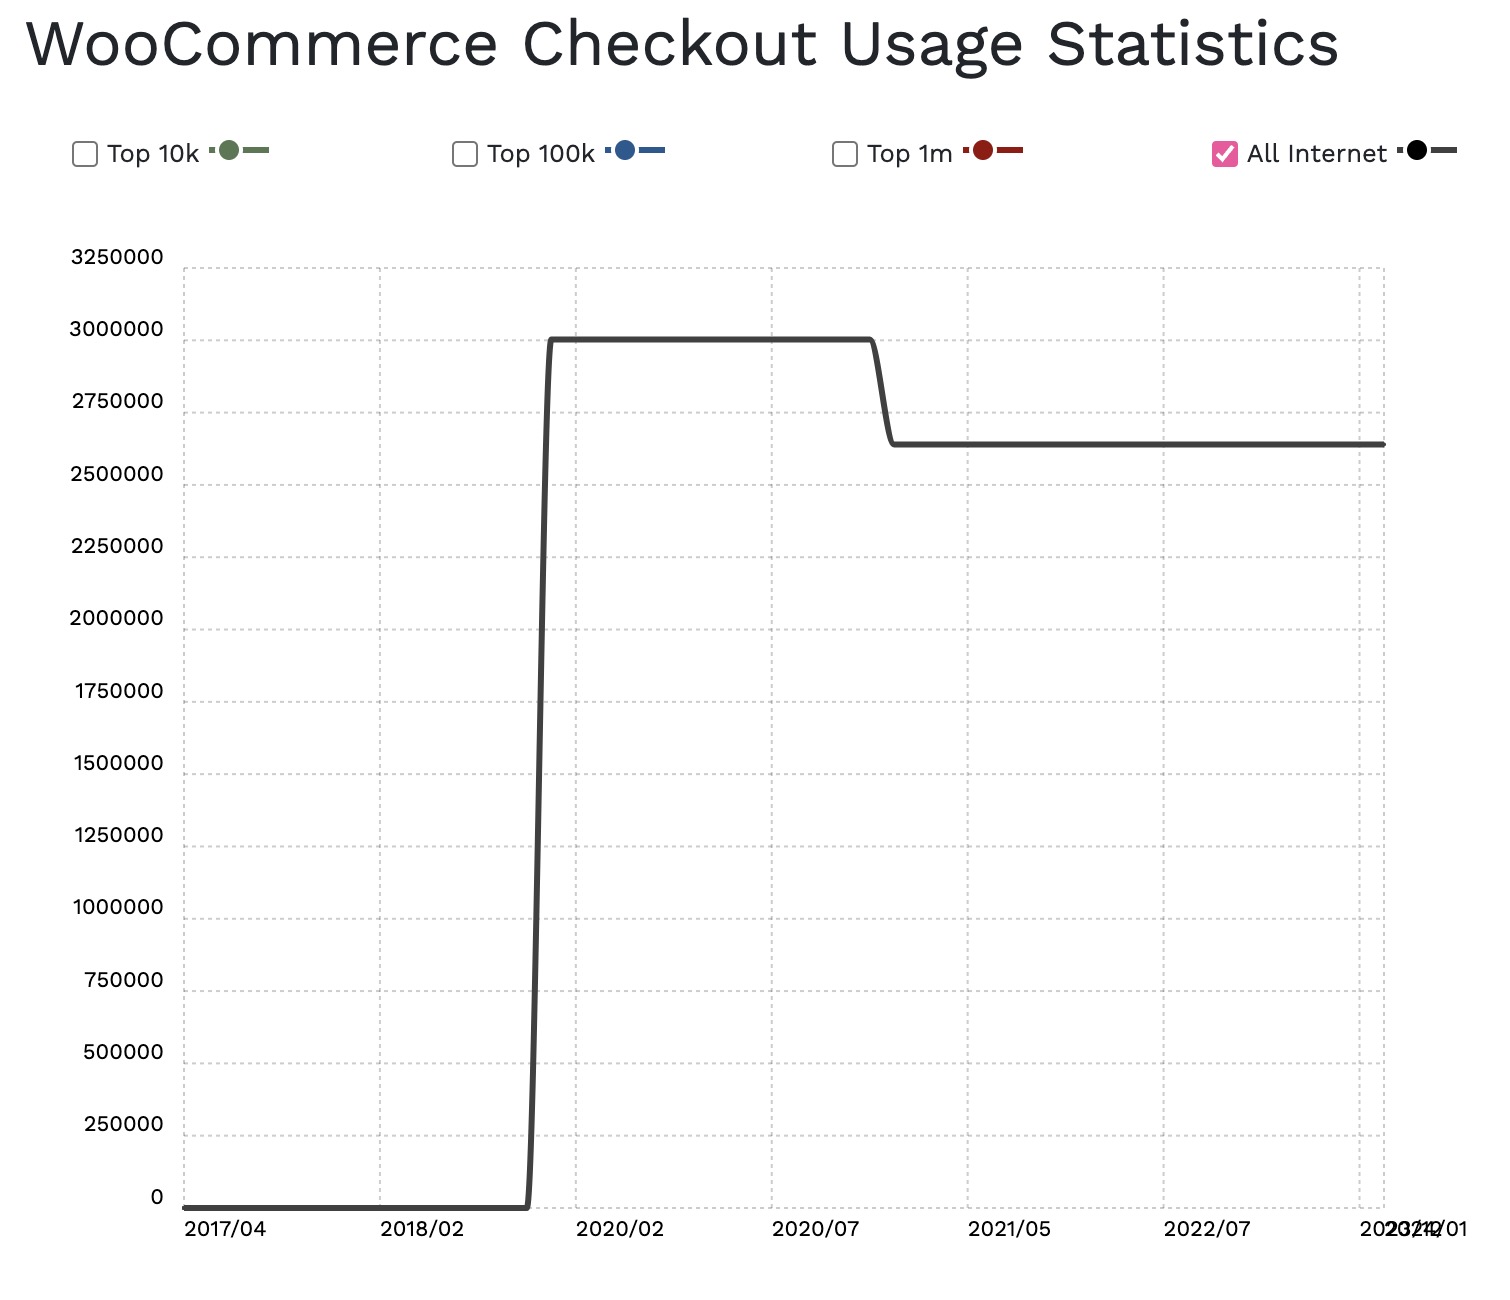
WooCommerce and Shopify are in a head-to-head battle for the #1 e-commerce platform.
According to BuiltWith.com, there are around 2.75 million websites using a WooCommerce checkout page (there are, apparently, also many Woo sites not using the standard checkout and/or any checkout at all).
Similarly, there are around 2.75 million Shopify sites.
Shopify usage remains high but has been decreasing since 2022:
WooCommerce e-commerce is trending similar to Shopify:
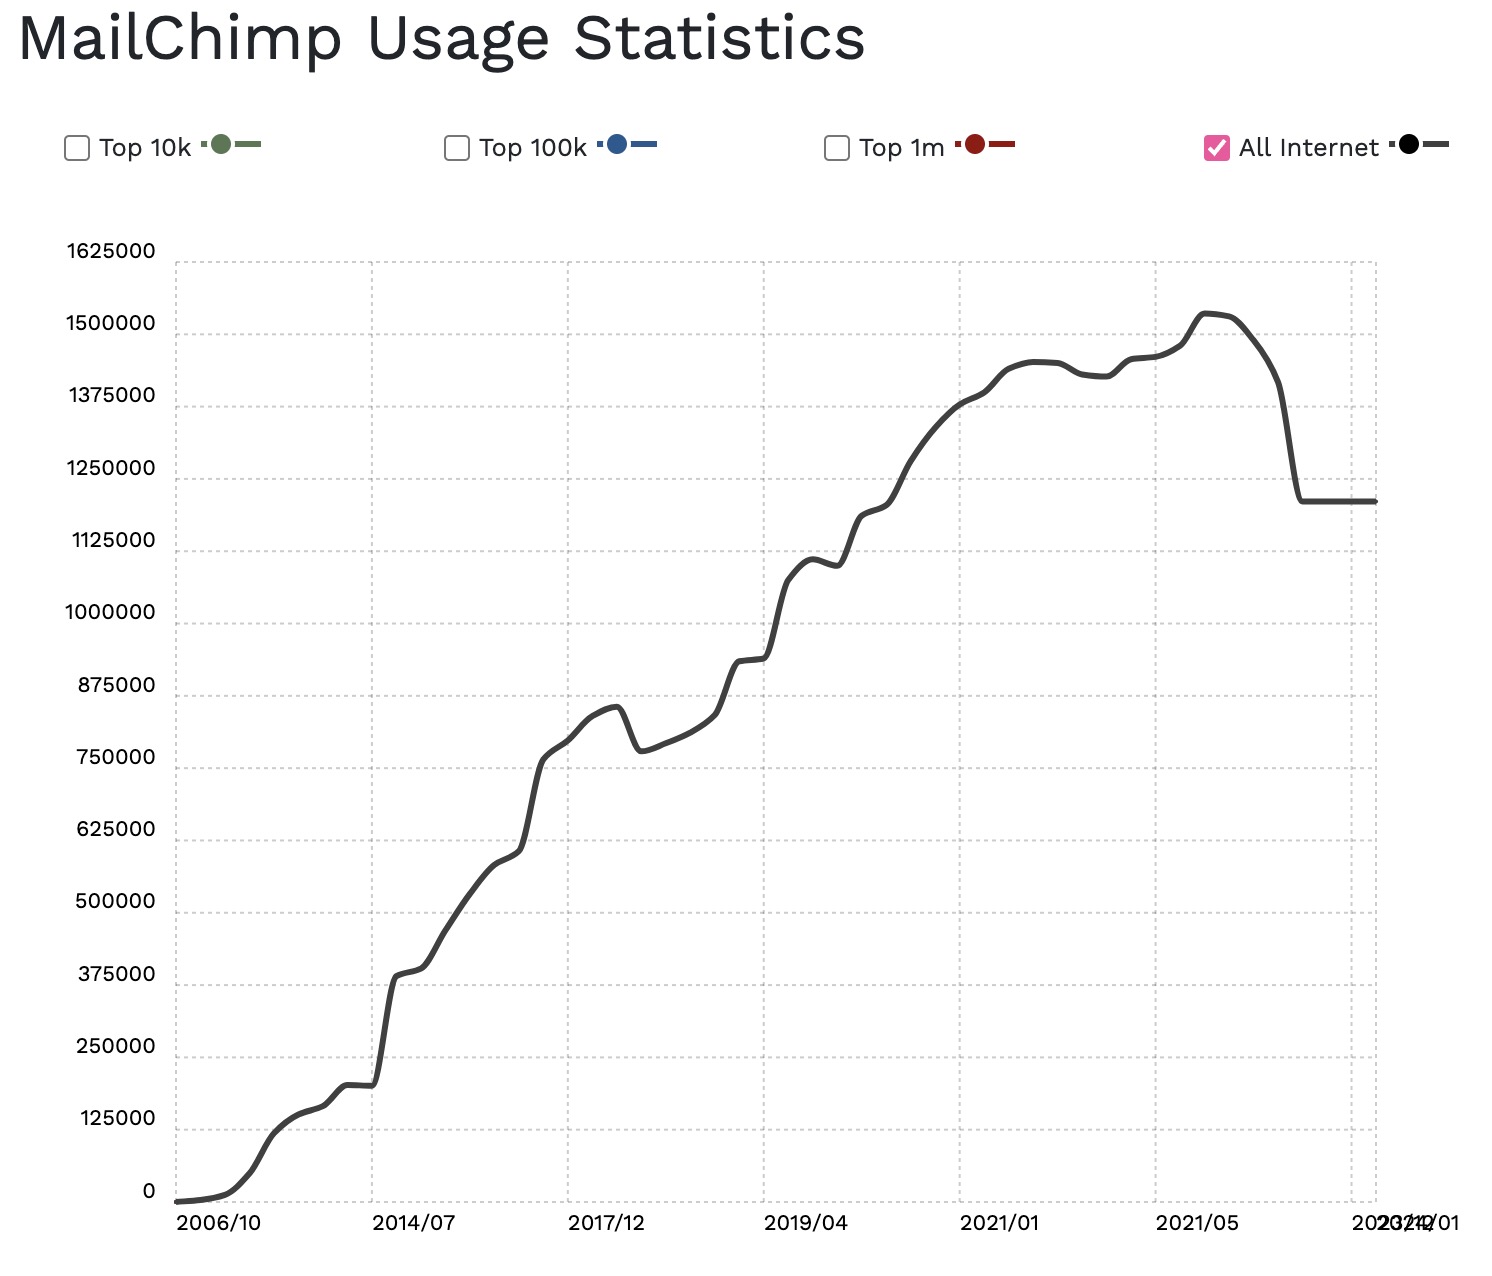
Mailchimp is down; Zoho Mail and Google Business are up.
This section includes some stats I found notable due to the fact that these are products many of the small business owners and WP consultants I converse with use and recommend regularly.
Mailchimp’s usage downfall seems to coincide with its acquisition by Intuit in 2021:
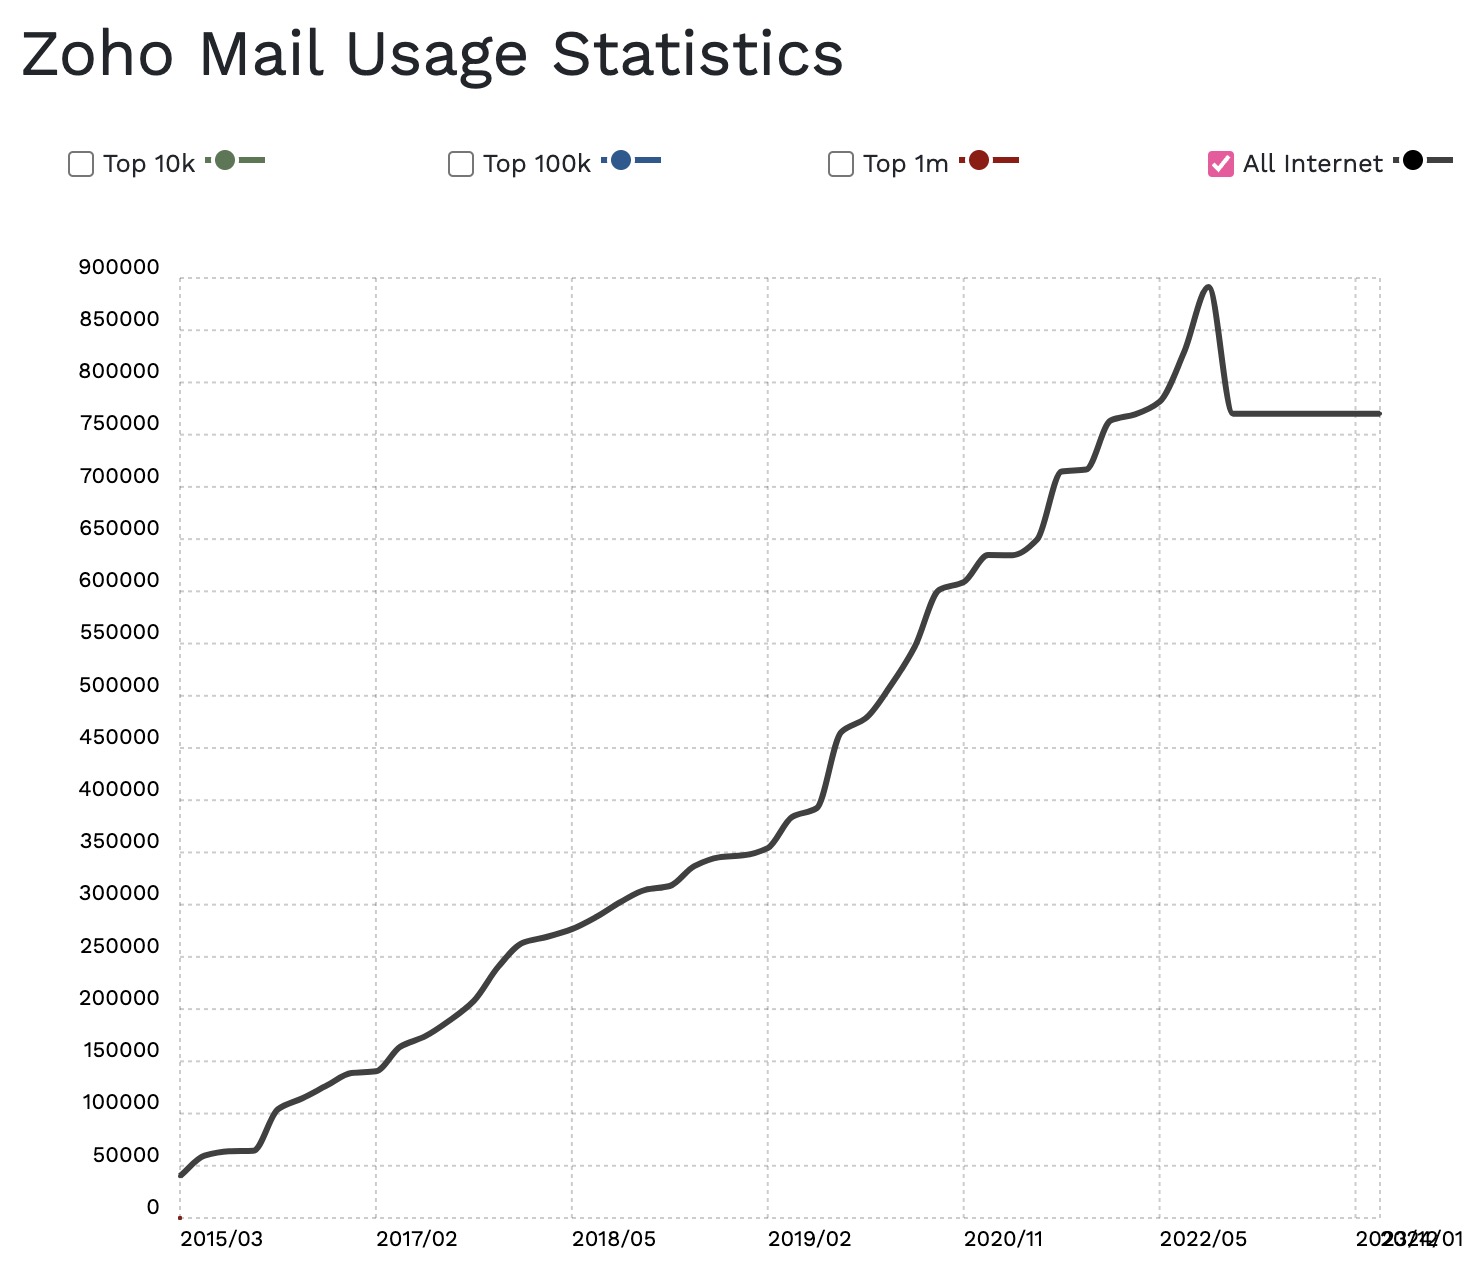
Zoho Mail, meanwhile, seems to be mostly successful with its low-cost/high-feature business model.
For example, Zoho Mail usage is up quite a bit since 2020, though usage dipped a little in 2022:
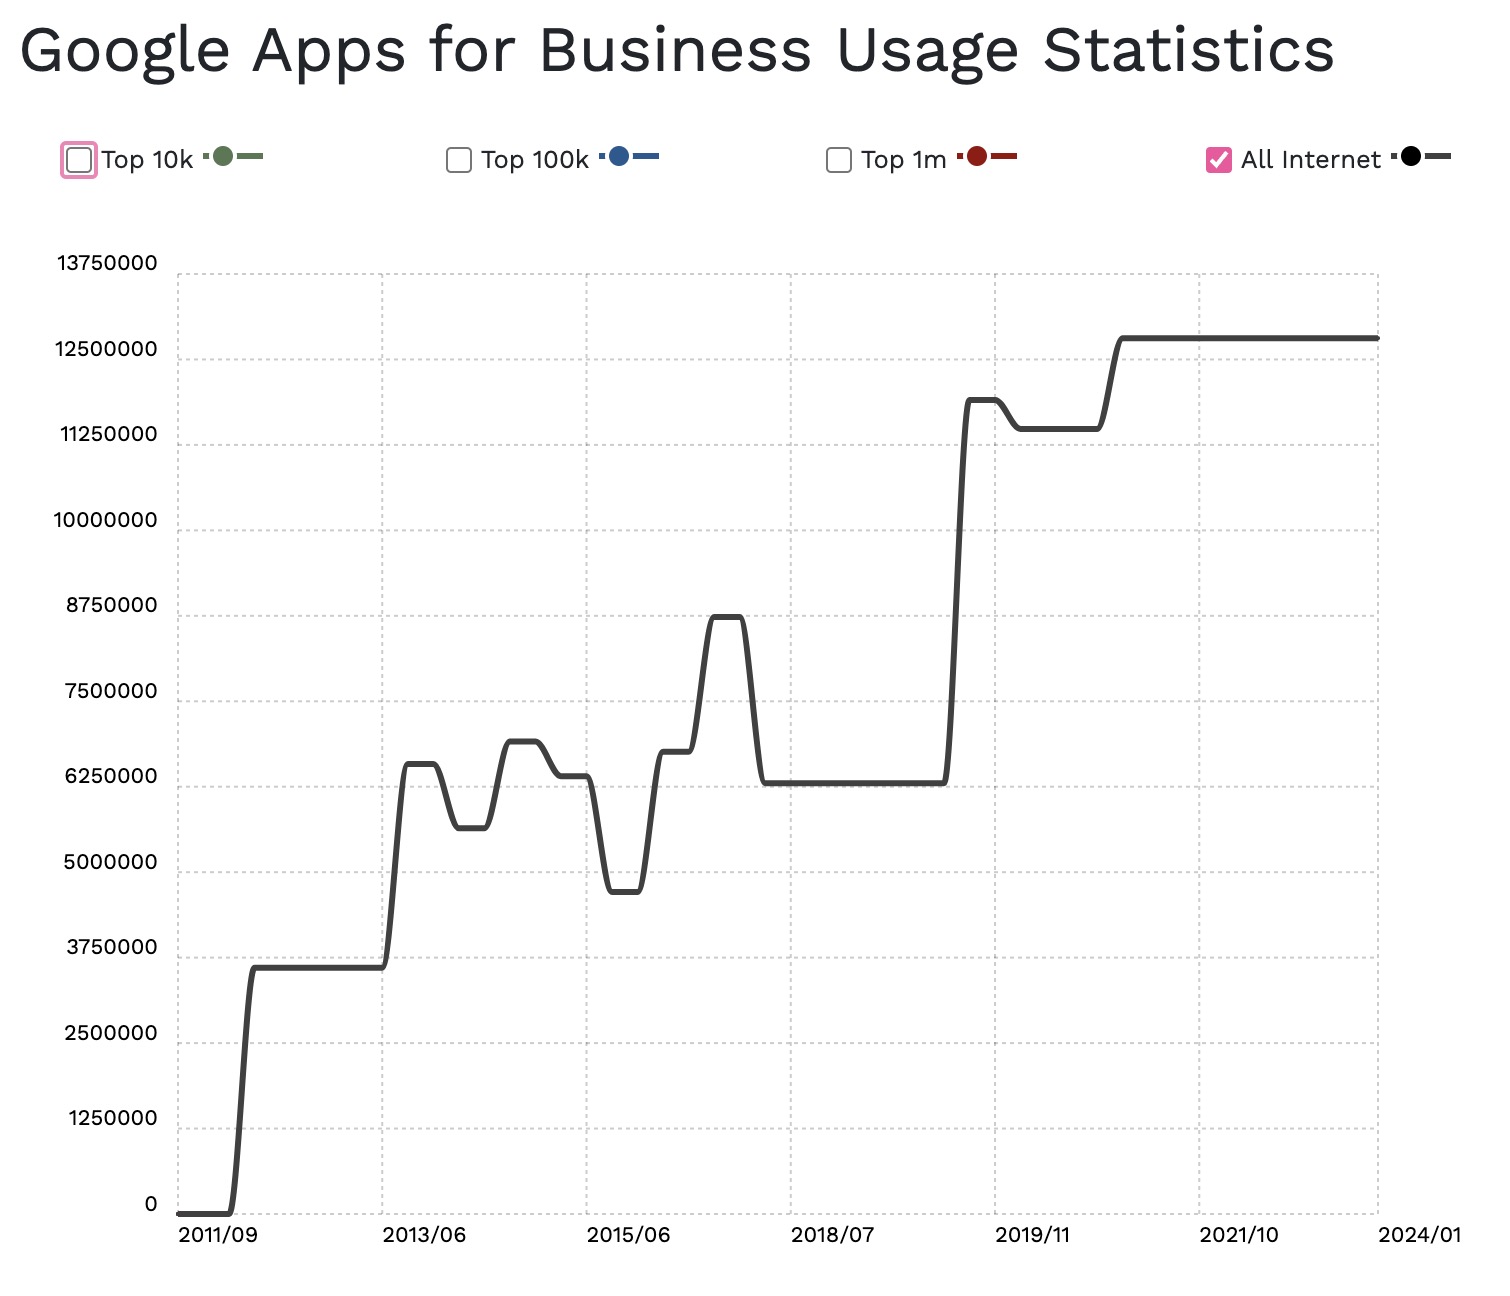
Meanwhile, the old guard isn’t sleeping. Google Workspace (formerly Google Apps for Business) is up up up:
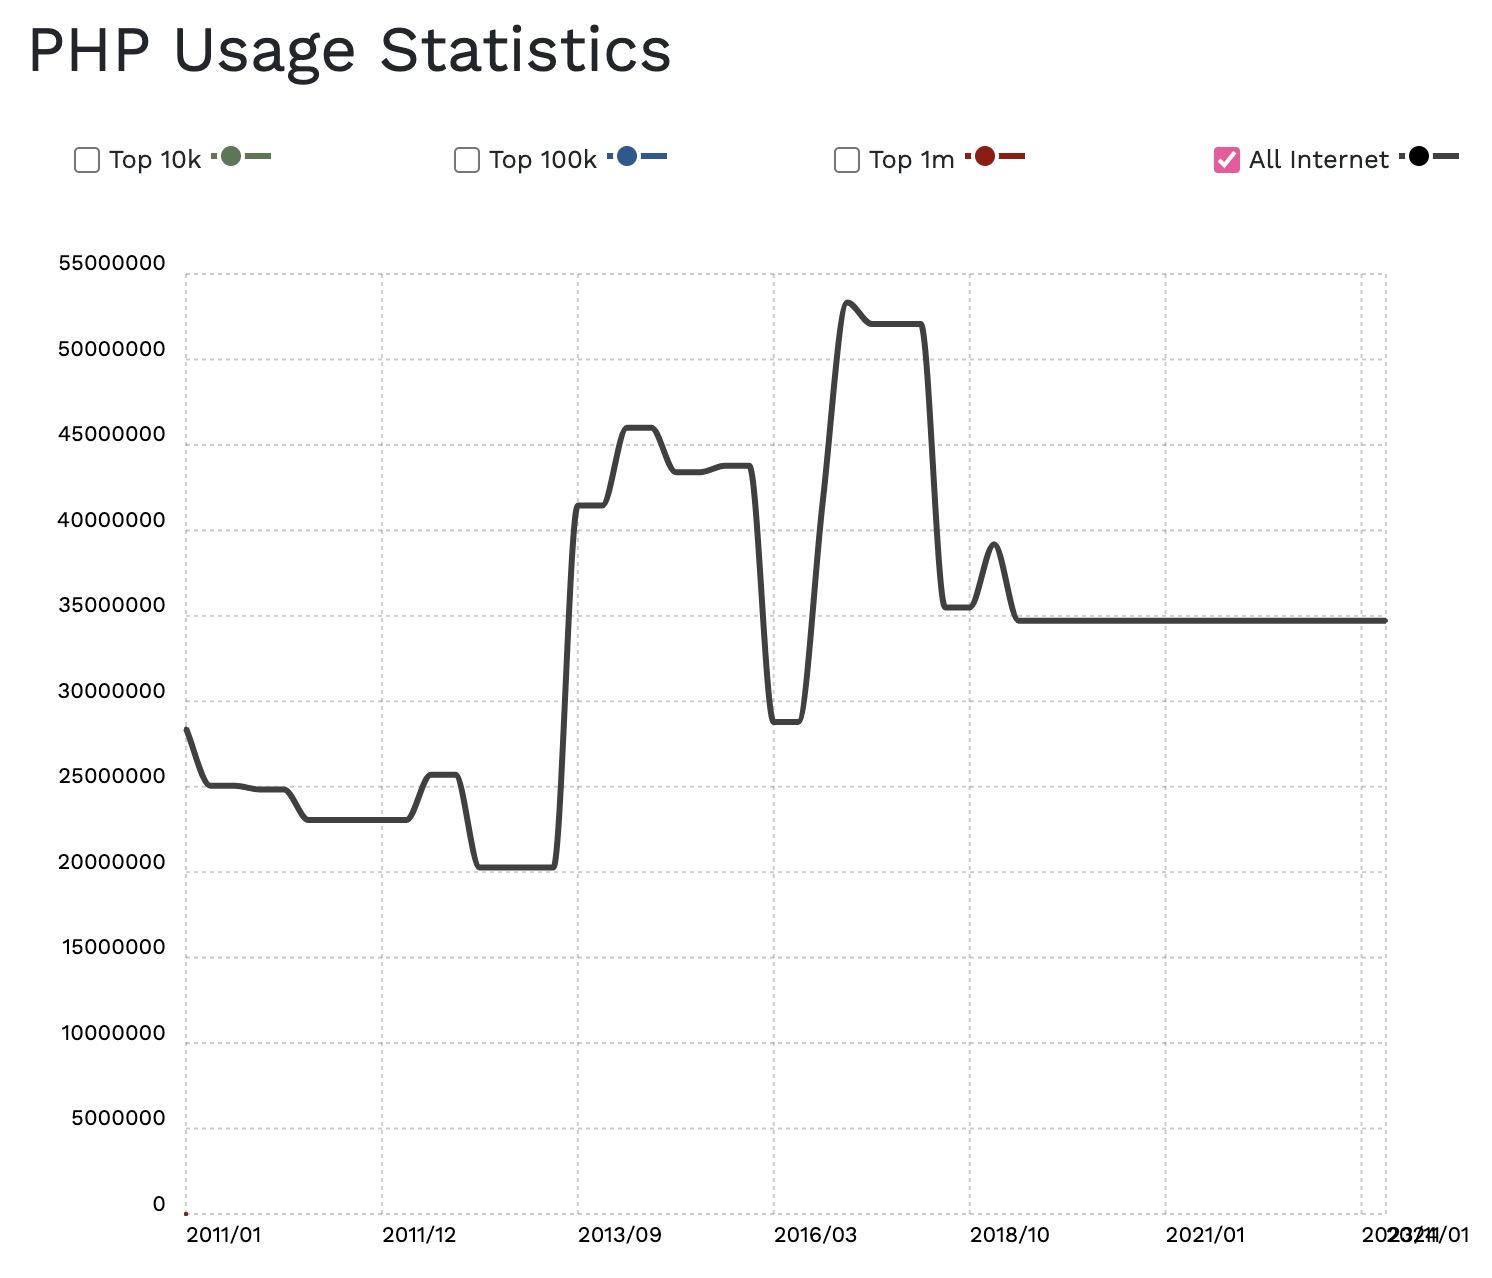
How is our old friend, PHP, doing?
PHP usage has been down considerably for 6 years but still powers around 35 million websites, most of which are, presumably, WP sites:
About the Data
I pulled this data from reliable Internet sources and linked those sources above. However, as with all data sets, it’s possible these sources are either incorrect or that the data doesn’t tell the whole story.
If you notice anything in my data sets above that needs to be corrected, let me know in the comments.
Similarly, if you find alternate data sources that tell additional stories, please let us know in the comments.
Related Historical Links
- WordPress Powering Practically Half Of The Top 10,000 Websites (WP Tavern, Aug. 2011)
- WooCommerce Dominates Global E-Commerce Platforms, Passes 7 Million Downloads (WP Tavern, April 2015)
- BuiltWith Reports a 7% Increase in WordPress’ Usage from January – July 2015 (WP Tavern, July 2015)
- Some Surprising Trends in Website Development (My analysis from 2022)
What do you think?
Similar to last week’s Tavern post about WP.org theme usage, data found on this page is likely best used as a fun conversation starter rather than a place to draw firm conclusions about anything. What is your reaction to this data? Did anything surprise you? Let me know in the comments below.